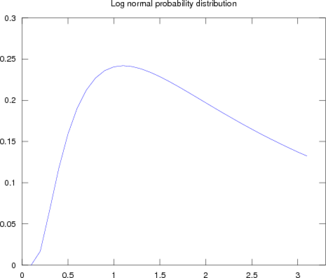
Lognormal distribution
where
Two parameters: , location; its scale.
Code to reproduce this plot in octave:
1
2
3
4
5
6
7
8
9
10
11
p=lognpdf([0:0.1:3],1,1);
plot(p);
axis([0,33,0,0.3]);
title("Log normal probability distribution");
for i=1:7
xl{i}=num2str(x((i-1)*5+1));
end
xl{8} = ' ';
set(gca, 'XTicklabel', xl);
print('lnpdf.ps', '-dpsc2');
# convert lnpdf.ps -trim -resize 70% lnpdf.png