Normal distribution
very commonly used distribution
The variable is said to be normally distributed with mean and variance as and . All normally distributed variables can be compared to each other by transformation to the standard normal distribution: where The number of standard deviations away from the mean translates to the probability when or when
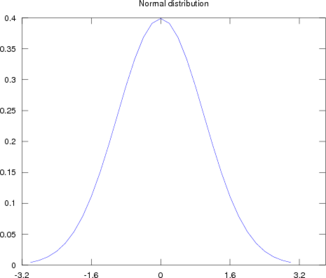
Code to reproduce this plot in octave:
1
2
3
4
5
6
7
8
p=normpdf([-3:0.2:3],0,1);
plot(p);
title("Normal distribution");
xt2=[0,8,16,24,32];
set(gca,'XTick',xt2);
set(gca,'XTicklabel',{'-3.2','-1.6','0','1.6','3.2'});
print('npdf.ps','-dpsc2');
# convert npdf.ps -trim -resize 70% npdf.png